Access Grafana from Anywhere - Without VPN
Secure remote access to your Grafana via SSH tunnel. No VPN, no port forwarding, no static IP. Setup with one command.
- Secure HTTPS tunnel
- Zero router configuration
- Monitor from anywhere
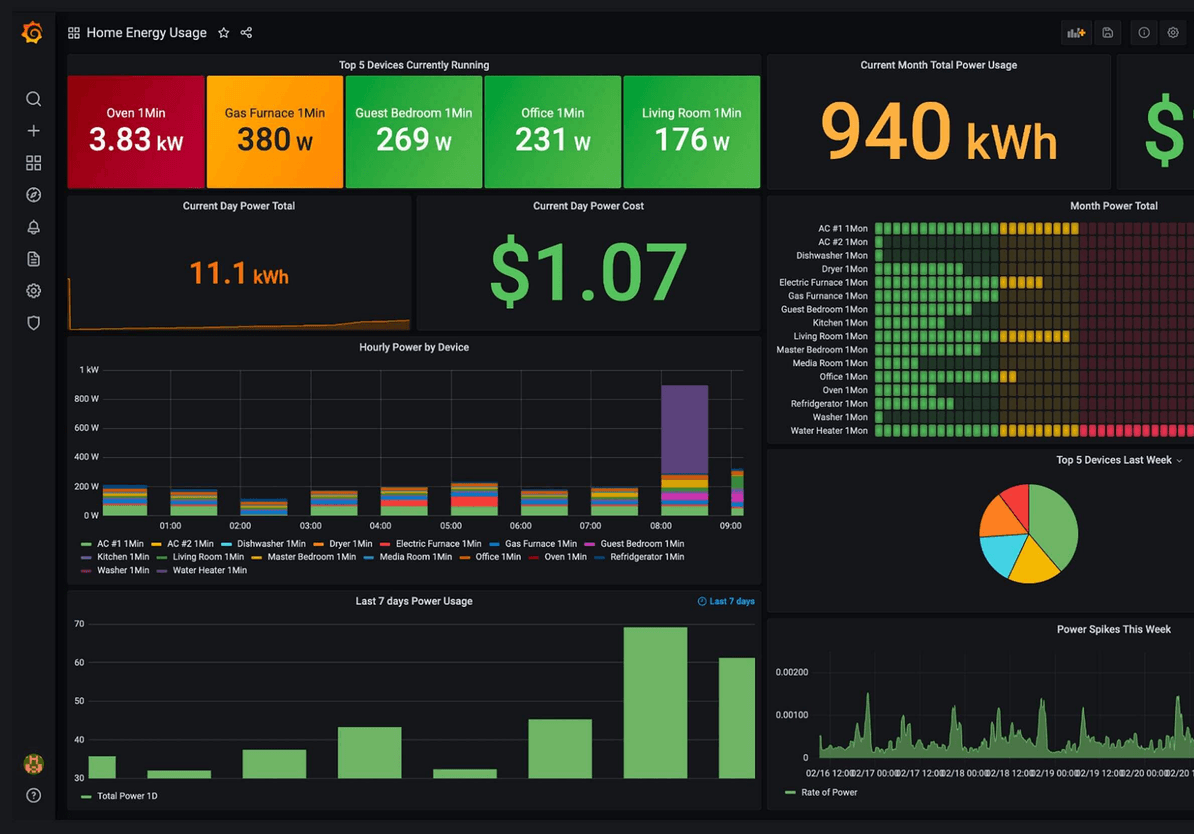
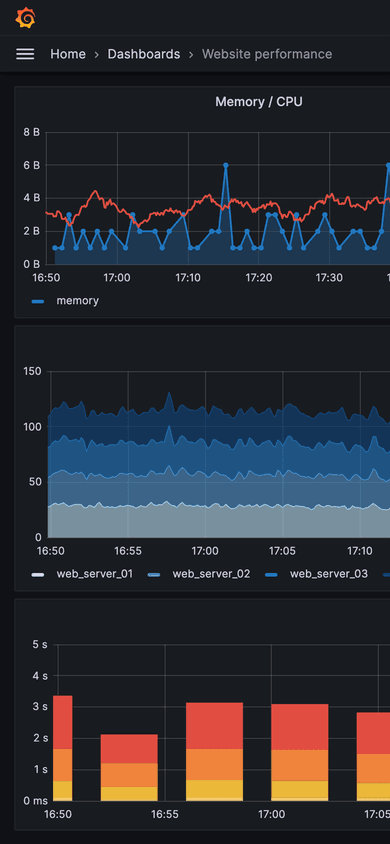
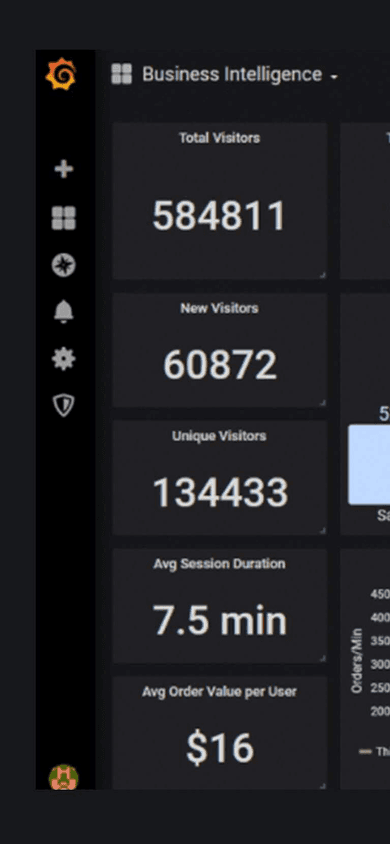
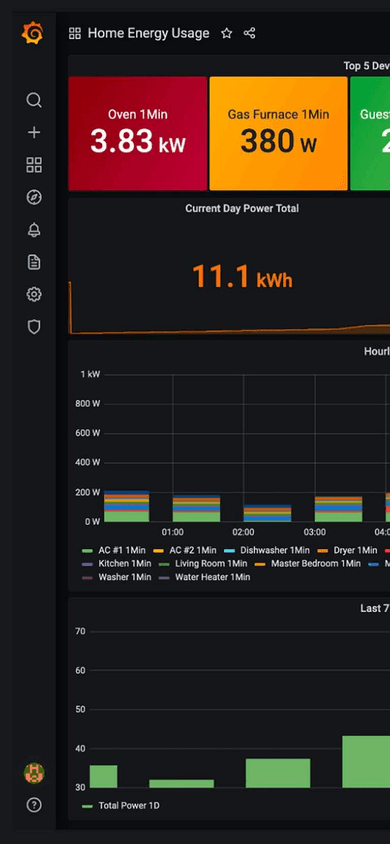
Why remote access to Grafana is so hard
Grafana on your home server is powerful - but external access is a challenge
Port forwarding exposes your dashboards
Opening port 3000 on your router exposes Grafana and your Prometheus data to attacks. By default Grafana doesn't enforce HTTPS.
VPN complicates quick metric checks
WireGuard or OpenVPN drain battery, don't reconnect on network changes, and complicate quick graph checks on your phone.
CGNAT blocks incoming connections
Many ISPs use CGNAT, making port forwarding and DDNS impossible. Without a public IP, you have no options.
From zero to remote access in 3 steps
No networking knowledge required
Install the agent
One curl command on your Grafana server. The agent installs as a system service and starts automatically.
Get your HTTPS subdomain
Your Grafana gets a permanent subdomain (e.g., smith.smarthomeentry.com) with automatic SSL certificate.
Monitor from anywhere
Open the subdomain in your browser - phone, tablet, laptop. Your Grafana dashboards are always within reach.
Perfect for Grafana users
Everything you need for secure remote access
Works with any Grafana setup
Docker, Raspberry Pi, Linux, bare-metal - SmartHomeEntry works with any Grafana installation method.
Your own HTTPS subdomain
A permanent, memorable address with SSL certificate. No more unsecured connections to your dashboards.
Full dashboards with alerts
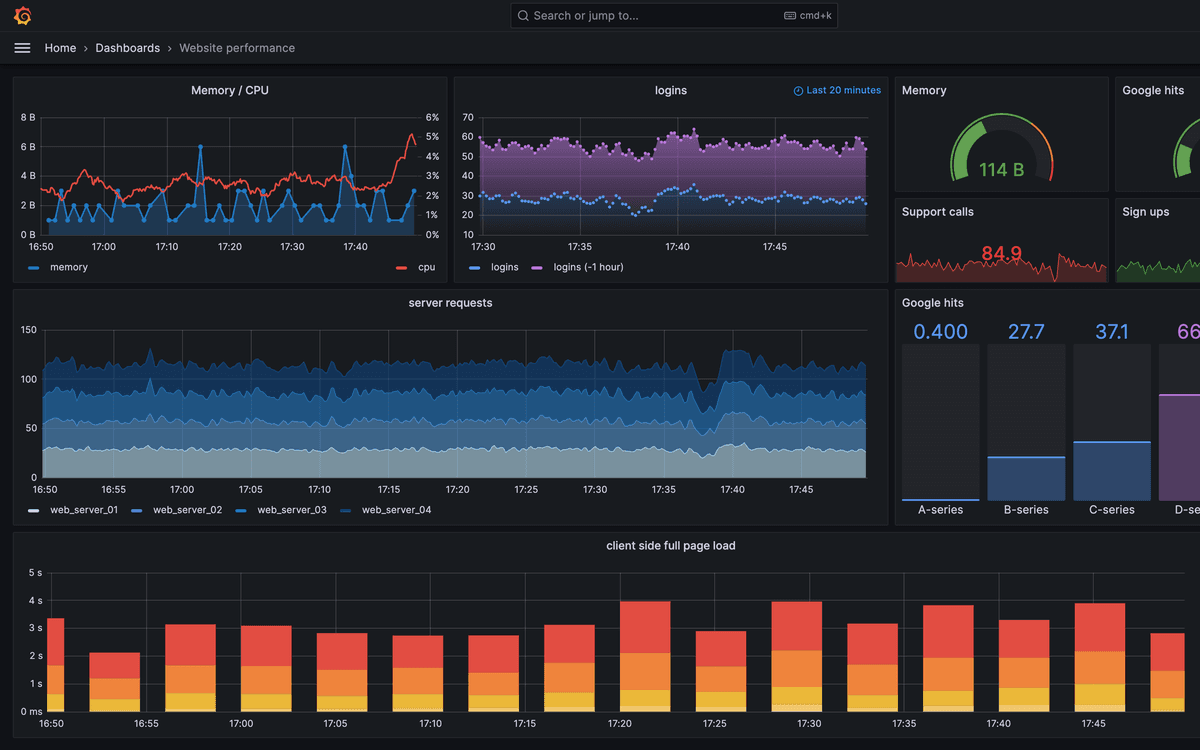
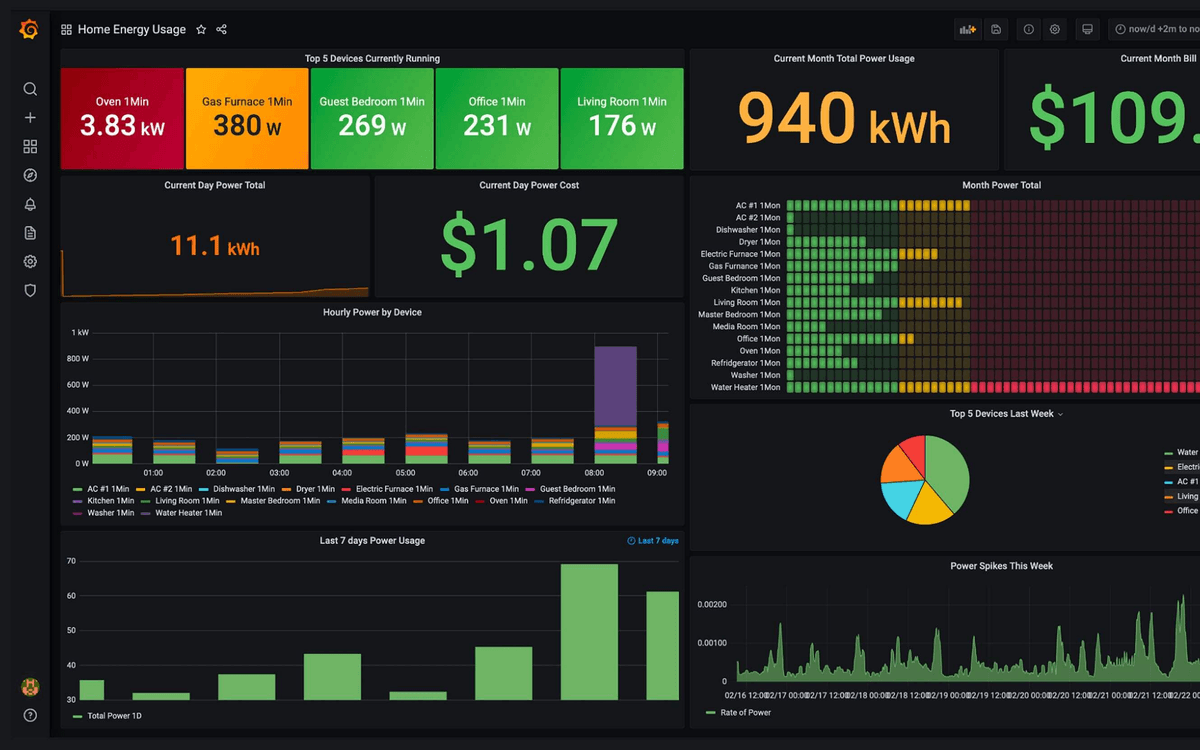
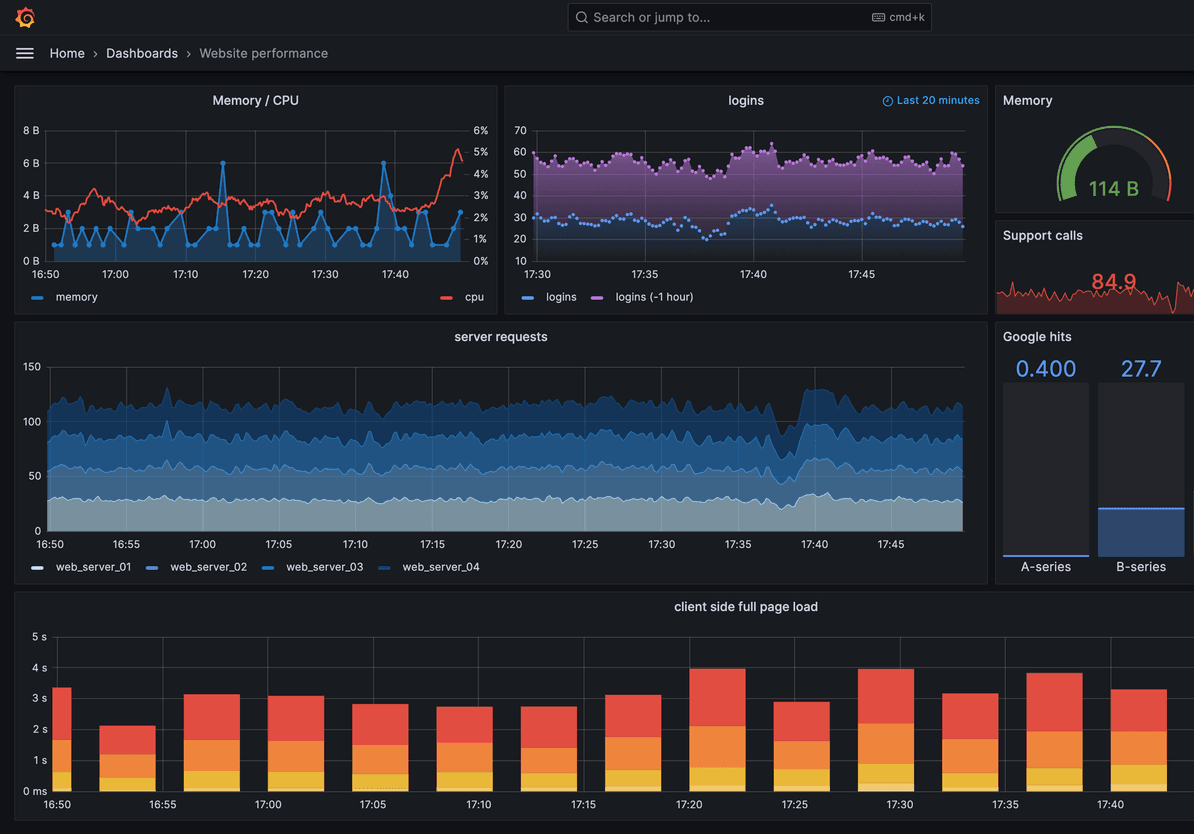
All your Grafana panels, charts, alerts, and data sources - accessible from any browser with no lag.
No static IP or DDNS required
Works behind CGNAT, dynamic IPs, and restrictive ISPs. The agent makes only outbound connections.
Health monitoring & alerts
Know when your Grafana server goes offline. Get email or webhook notifications within minutes.
SmartHomeEntry vs. alternatives
See how we compare to traditional solutions
| SmartHomeEntry | Port forwarding | Tailscale | |
|---|---|---|---|
| Setup time | ~2 min | ~30 min | ~15 min |
| No router config | ✓ | ✗ | ✗ |
| Your own HTTPS subdomain | ✓ | ✗ | ✗ |
| One-command install | ✓ | ✗ | ✗ |
| Works without static IP | ✓ | ✗ | ✓ |
* Tailscale requires installing a client on every device
Grafana remote access - frequently asked questions
Install the SmartHomeEntry agent with one curl command on your Grafana server (Docker, Linux, Raspberry Pi). The agent opens a reverse SSH tunnel to our relay and registers a permanent HTTPS subdomain. Open your dashboard in a browser from anywhere - no VPN, no open port 3000.
No. Grafana Alerting uses outbound HTTP to send alerts (Slack, Discord, Telegram, email, custom webhooks) - it doesn't need remote access. SmartHomeEntry is only for BROWSING dashboards and configuring alerts from outside. Both work in parallel.
Yes. Use Grafana's built-in "Share panel" → "Link" or "Snapshot". Grafana generates a URL that works with your SmartHomeEntry subdomain - the recipient just opens the link in a browser, no Grafana account, no VPN. For anonymous viewing, set `GF_AUTH_ANONYMOUS_ENABLED=true` in Grafana.
Our relay sits in Warsaw, Poland (OVH). Measured from a Polish connection: 12-22 ms round-trip. The further from Warsaw, the more - for Western Europe expect a few tens of milliseconds, though we have not measured that ourselves and would rather not quote numbers we cannot back. In practice it is unnoticeable when browsing dashboards (they are cached client-side). Chart data fetches from Prometheus/InfluxDB happen locally at your server - the tunnel is only for the UI.

Get remote access to Grafana with one command
Get started now. No router configuration needed.
Same tunnel, any web service
One agent exposes everything on your network - pick another integration below.
Related articles
In-depth guides and case studies for this integration